|
What is the Mandelbrot Set?
... .... .... |
The black lying figure opposite is the Mandelbrot set
called after its discoverer.
In Germany we call it Apfelmännchen (apple-man)
because of its shape.
The illustration is in a coordinate system in the region
-3 < x < 2 and -2 < y < 2. |
The computer graphics are formed by coloured points. The
colours are derived from the coordinates (see more below).
The frayed edges of the Mandelbrot set are special. It
is full of patterns. If you pick out a small box of the edges and calculate
colours with the formula of the Mandelbrot set, you get different colourful
patterns depending on the place.
...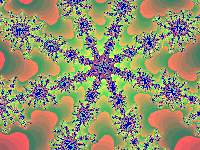 ... ... |
You find this example at the box
- 0.37465401 < x < - 0,37332411 and
+0.659227668 < y < +0,66020767. |
Mathematical
Background top
(You can skip this chapter and
go to First Contact to Winfract.)
A short summary: To every point given by two coordinates
you find a sequence and take a number from this sequence. This number is
the code in a colour chart. The point gets this colour.
From Point
to Sequence
top
If you use complex numbers, the recurrence relation of
the sequence is zn+1=zn² + c.
c=x1 + y1*i is the number which
a colour has to be calculated for.
z0=0 is the start number.
The sequence is |zn|.
I choose the way with real numbers, because not many people
are familiar with complex ones.
You use the following formulas for the Mandelbrot set.
xn+1 = xn²-yn²
+ x1 and yn+1 = 2*xn*yn+ y1
and an+1 = SQRT(xn+1² + yn+1²)
with n = 0,1,2,3,... and the start values x0=y0=0.
(SQRT = square root).
I explain the calculation with point P1(x1|y1)
= P1(-0.40|0.70) as an example.
I start with point N(0|0).
There is x1 = x0²-y0²
+x1 = 0-0+x1 = and y1= 2*x0*y0
+
y1= 2*0*0+y1= y1,
a1 = SQRT(x1² + y1²)
= SQRT[(-0.40)² + 0.70²] =0.81.
The first term a1 is the distance of point
P1from the origin of the coordinate system.
The second term is derived from the coordinates of the
given point P1.
You calculate two new coordinates for a second point
P2:
x2 = x1²-y1²
+x1 = (-0.40)² - 0.70² + (-0.40) = -0.73 and
y2= 2*x1*y1 + y1= 2*0*0+y1
= 2*(-0.40)*0.70+0.70 = 0.14.
So you find a2 = SQRT(x2²
+ y2²) = SQRT[(-0.73)² + 0.14²] = 0.74.
The third term is derived from the coordinates of the
previous point P2 and the given point P1.
You calculate two new coordinates for a third point P3:
x3 = x2²-y2²
+x1 = (-0.73)² - 0.14² + (-0.40) = 0,11 and
y3= 2*x2*y2 + y1
= 2*(-0.73)*0.14+0.70
= 0.50.
So you find a3 = SQRT(x3²
+ y3²) = SQRT(0.11² + 0.50²) = 0.51.
In this way you get the sequence 0.81, 0.74, 0.51,
1.0, 0.74, 1.1, 1.8, 2.4, ... belonging to
the given point P1(-0.40|0.70).
Five
Points and their Sequences top
The following chart shows the sequences of five points
(examples) calculated by the same method.
.
.
Nr.
1
2
3
4
5
6
7
8
9
10
11
12
13
. |
(0.20|0.20)
1st sequence
0.23
0,34
0.35
0.33
0.30
0.30
0.31
0.32
0.32
0.31
0.31
0.31
...
. |
(0.10|0.65)
2nd sequence
0.66
0.84
0.44
0.57
0.91
0.83
0.38
0.70
1.0
0,77
0.83
1.3
2.1
...
. |
(-0.40|0.70)
3rd sequence
0.81
0.74
0.51
1.0
0.74
1.1
1.8
2.4
4.9
24
560
320 000
...
. |
(0.50|1.30)
4th sequence
1.4
2.8
6.5
43
1900
3 500 000
...
.
.
.
.
.
.
. |
(2|2)
5th sequence
3.6
16
260
68 000
...
.
.
.
.
.
.
.
.
. |
I rounded all numbers on 2 digits.
The first sequence is convergent with limit equal to 0.31.
(The points with convergent sequences form the Mandelbrot set.)
The other sequences are divergent. The terms get larger
and larger without limits, but not in the same way.
From
the Sequence to the Colour top
If a term of the sequence exceeds 2 in number (red),
you can assume that the sequence gets larger and larger. This corresponds
with the experience.
If you exceed 2, you write down the number of the previous
term. It is the code of a colour chart.
I make a note of these numbers in tabular form:
Point:
Colour: |
(0.2|0.2)
black |
(0.10|0.65)
12 (2) |
(-0.40|0.70)
7 |
(0.50|1.30)
1 |
(2|2)
0 |
You give the colour black to the first point with the
convergent sequence. So the Mandelbrot set becomes black.
Provided that you have a palette with 10 colours (0 to
9). If the number is larger than 9, you take the remainder of 10 (number
mod 10). E.g. you take 2 instead of 12 in the second sequence.
Now the points can be drawn.
Computer in Action
top
The mathematical background up to now results in a huge
material of numbers. You must calculate and analyse a sequence to every
point. A computer can only do this.
The computer cannot avoid one mistake: It cannot calculate
all terms of a sequence. If it investigates only 50 terms for instance,
maybe the sequence doesn't exceed 2 in number, nevertheless it is divergent.
You make the mistakes less crass, if you determine more terms (e.g. 500).
Nearly everyone who writes computer programs and is interested
in computer graphics has had a try with the Mandelbrot set. It is an unforgettable
experience if a simple program produces the complicated Mandelbrot set
for the first time. In former times it took hours and hours (Commodore
64 nostalgia!).
Every own attempt of programming fades beside the standard
program Fractint für Windows (Winfract), which has been
developped by the "Stone Soup Group".
First Contact
to Winfract
top
If you want to occupy with the Mandelbrot set, you must
really use this program.
I describe version 18.21. The program is freeware. Copyright:
(c) 1990-1993 The Stone Soup Group. It is available on the internet.
Please look at http://en.wikipedia.org/wiki/Fractint.
After starting the program the Mandelbrot set appears.
You form a small box with the mouse and move it with pressed mouse button
to an edge. Then you press the enter key. A new picture appears on the
screen. If you want you can look for a new place and press the enter key.
The patterns repeat. You recognize self similarities.
...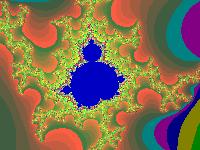 .... .... |
You often discover small, dark blue spots, which become
Mandelbrot sets after magnification. Sometimes the "head" is crooked.
Place:
0.435396403 < x < 0.451687191
0.367981352 < y < 0.380210061 |
You find a nice background picture for your computer at the
place
-0.567709792 < x < -0.557685031 and 0.638956191
< y < 0.646482313
You set a palette in grey with Colors/Load Color Map.../altern.map
.
If you save a picture, the coordinates of the boxes are
also recorded. You find them with View/Status.
You see the coordinates with View/Coordinate Box.
You can feed the coordinates into the computer via Fractals/Fractal
Params...
You must choose Fractals/Reset all Options before
looking for a new picture.
... ... ... |
Often it is good to exceed the number of the terms of
a sequence with
Fractals/Basic Options and Maximum Iteration.
You should choose 500 or 1000 terms instead of the set 150 ones (see above).
The graphics show more details, as the animated gif on the left shows. |
... ... ... |
You find very nice pictures inside the three white boxes
after magnification. |
The program makes possible a trip through the fractal
geometry beyond generating the Mandelbrot set. You must choose new formulas
with Fractals/Formula...
.
Julia Sets
top
If you press the right mouse button being inside the
program Winfract, you get symmetric Julia sets. You return to the
Mandelbrot set if you press the button a second time. You always find a
new Julia set to every point of the Mandelbrot set.
You see three Julia sets below. The pictures belong to
the inside, the edges and the outside of the Mandelbrot set going from
the left to the right. The picture in the middle shows fully detailed patterns
with big depths.
You calculate Julia sets with the same formulas as above,
but with another handling. You give into xn+1 = xn²-yn² +x0'
and yn+1 = 2xn*yn+y0' and an+1 = SQR(xn+1²+yn+1²) the coordinates
of the point P(x0'|y0'), which you choose with the mouse button. You substitute
the starting coordinates x0,y0 with the formula for the points. Those
are the coordinates of the point, whose colour you want to calculate.
You also come to Julia sets inside Winfract, if
you choose Fractals/Formula... Julia. Now it is possible to give
precisely two coordinates. You can't do it with the mouse button.
Mandelbrot
Set on the Internet top
German
Albert Kluge
Das
fraktale Apfelmännchen (Mandelbrot-Menge) als Java-Applet
Alexander F.Walz
Die
Mandelbrotmenge
Christian Gloor
Fractals
Christian Symmank
Bilder
der Mandelbrot Menge
Hanno Rein
Mandelbrot
und Julia (Applet)
Manfred Thole
Apfelmännchengalerie
Apfelmännchen, erzeugt in sechs Programmiersprachen:
Java-Code, PostScript-Code, TeX/LaTeX-Code, C-Code, Mathematica-Notebook,
Macsyma-Code
Stefan Bion
Apfelmännchen
in JavaScript
Thomas Hövel
wincig (Fraktalprogramm
zum Herunterladen)
Wikipedia
Mandelbrot-Menge,
Fractint
English
Eric W. Weisstein
Mandelbrot
Set
Jules Ruis
Centre for Fractal
Design and Consultancy
M. Eric Carr
Mandelbrot
Zoom (Video at youtube)
Michael Frame, Benoit Mandelbrot, and Nial Neger
Fractal Geometry
Robert Munafo
Mu-Ency
- The Encyclopedia of the Mandelbrot Set
Wikipedia
Mandelbrot
set, Fractint
References
top
T.Wegener, M.Peterson, B.Tyler, P.Branderhorst: Fraktale
Welten für Windows, München 1993
James Gleick: Chaos - die Ordnung des Universums, Knaur
München 1988
Feedback: Email address on my main page
This
page is also available in German.
URL of
my Homepage:
https://www.mathematische-basteleien.de/
©
2000 Jürgen Köller
top |